1. Overview
SmuView is a graphical frontend for the libsigrok library, permitting access to a wide range of devices to let you record, analyze, process and export analog data. It is part of the sigrok suite, just like the libraries that it makes use of.
The sigrok suite needs some kind of hardware to interface to the signals you want to examine or control. SmuView currently supports a wide variarity of analog devices like power supplies or electronic loads. Both of these device types are most of the time controllable. There is also a large number of measurement devices that are supported by SmuView like multimeters, LCR meters, sound level meters, thermometers, hygrometers, anemometers, light meters, energy meters, tachometers and scales.
Please be aware that SmuView does not support devices that either work as oscilloscopes, logic analyzers or mixed-signal devices. This device types are currently only usable with either sigrok-cli or PulseView.
However, oscilloscopes will be supported in the future to perform high frequency measurements (like voltage ripple on switch mode power supplies) or measurements in the frequency domain (e.g. for filter characterization).
The SmuView user interface is geared towards controlling devices and analysis of captured data. From here, you can access all features.
Before we dive deeper into how to accomplish things, let’s make SmuView available on your system first.
2. Installation
SmuView can be run on Linux and Windows. Mac OS X is not tested yet. For Windows we provide installers and for Linux we provide AppImage containers that you can run without the need to install anything. Check the SmuView download page to see which option is available for your platform.
2.1. Linux
You have two options to install SmuView:
-
Download and use the AppImage which contains all required files and needs no installation:
chmod u+x SmuView-0.0.5-x86_64.AppImage
./SmuView-0.0.5-x86_64.AppImage
Please be aware, however, that the AppImages are development releases at the moment, so they always contain the latest development changes. While we do try to keep the code base in a working state, it is sometimes unavoidable to introduce bugs that show up in the AppImage builds. If you encounter something that is odd to you, please download and install the latest release and check if the issue still exists. If it does, feel free to file a bug.
No system files are changed, so if you decide that you no longer want to use SmuView, simply delete the AppImage. If you also want to remove the stored settings, delete
~/.config/sigrok/SmuView.confas well. -
Uninstall any sigrok packages from your package manager and build SmuView from source:
[install dependencies as listed on the wiki]
mkdir ~/sr
cd ~/sr
git clone --branch smuview --single-branch "https://github.com/knarfS/sigrok-util.git"
cd sigrok-util/cross-compile/linux
./sigrok-cross-linux-smuview
export LD_LIBRARY_PATH=~/sr/lib
~/sr/bin/smuview
No system files are changed, so if you decide that you no longer want to use SmuView, simply delete the
~/srdirectory. If you also want to remove the stored settings, delete~/.config/sigrok/SmuView.confas well.
|
If you install SmuView using the AppImage or building from source, SmuView will
not be able to access USB and serial port devices unless it’s run as Here’s how you install them: sudo bash cd /etc/udev/rules.d/ wget -O 60-libsigrok.rules "https://sigrok.org/gitweb/?p=libsigrok.git;a=blob_plain;f=contrib/60-libsigrok.rules" wget -O 61-libsigrok-plugdev.rules "https://sigrok.org/gitweb/?p=libsigrok.git;a=blob_plain;f=contrib/61-libsigrok-plugdev.rules" wget -O 61-libsigrok-uaccess.rules "https://sigrok.org/gitweb/?p=libsigrok.git;a=blob_plain;f=contrib/61-libsigrok-uaccess.rules" sudo udevadm control --reload-rules |
2.2. Windows
We offer installers for SmuView that contain everything you need to get started. Simply download them from the SmuView download page and run them as any other Windows installer.
Please be aware, however, that the Windows installers are development builts, so they always contain the latest development changes. While we do try to keep the code base in a working state, it is sometimes unavoidable to introduce bugs that show up in the development builds. If you encounter something that is odd to you, please download and install the latest release and check if the issue still exists. If it does, feel free to file a bug.
After installation, you will find a program called Zadig in the start menu. By default, certain devices recognized by Windows will have drivers installed for them that SmuView cannot use. The purpose of Zadig is to let you change the driver Windows uses for a particular device - for most devices you’ll need to choose WinUSB to use them with SmuView or the original proprietary Windows driver to use it with whatever other software you access the device with. More details are available in the wiki.
In case your device doesn’t show up in SmuView and you can’t find it with a scan either (see next chapter), check with Zadig whether the correct driver is assigned for the device.
2.3. Mac OS X
We offer DMG installers for SmuvView that contain everything you need to get started. Simply download them from the SmuView download page and run them.
Please be aware, however, that the DMG installers are are development builts, so they always contain the latest development changes. While we do try to keep the code base in a working state, it is sometimes unavoidable to introduce bugs that show up in the DMG builds. If you encounter something that is odd to you, please download and install the latest release and check if the issue still exists. If it does, feel free to file a bug.
No system files are changed, so if you decide that you no longer want to use
SmuView, simply delete the DMG file. If you also want the stored settings gone,
delete ~/Library/Preferences/SmuView.plist as well.
3. Devices
SmuView supports a wide variety of analog devices. Because of that, some of the following terms may have a slightly different meaning for different device types.
A device can contain the following objects:
- Channel Group

-
A device can have no, one or more channel groups. Channel groups normally corresponds to a physical channel on the device itself.
A three output channel power supply for example will have three channel groups, probably named
1,2and3.A multimeter normally doesn’t have a channel group.
- Channel

-
A device can have multiple channels. Channels can be in a channel group or belong to the device itself.
A power supply normally has a voltage and a current channel per channel group.
A multimeter probably has one channel for the main display and maybe one for a secondary display.
- Signal

-
A channel can contain one or more signals. A signal represents the samples generated by the device.
Channels of power supplies, electronic loads and math channels always contain only one signal with a fixed quantity and unit.
Channels of multimeters may contain multiple signals, each one with a unique quantity, quantity flags and unit.
- Controllable

-
A device can have no, one or more controllables. Up to one controllable can belong to a channel group or to the device itself.
A power supplies channel group controllable can probably control the output voltage and current, enable OVP and OCP and enable the output .
- Config Key

-
A controllable contains one or more config keys. A config key controls a single property of the device like the sink current of an electronic load or enables the output of a power supply channel group. It may be read- and writeable.
This is the start screen, when you start SmuView without any command line parameters:
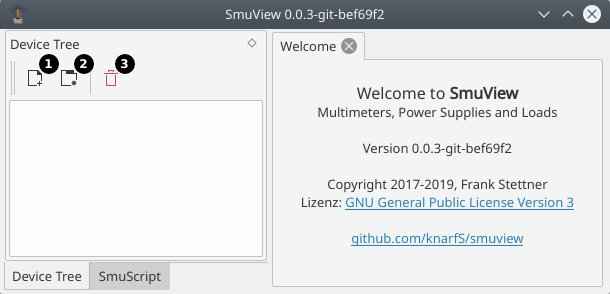
![]() Connect a new hardware device.
Connect a new hardware device.
![]() Create a new user device.
Create a new user device.
![]() Disconnect and close the selected device. All
acquired data will be lost!
Disconnect and close the selected device. All
acquired data will be lost!
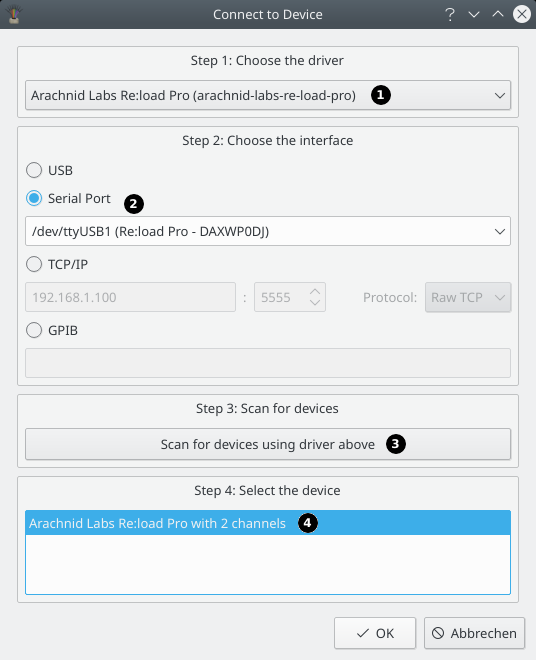
3.1. Connect a Device
You can connect a hardware device with a dialog or with a command line parameter.
When using the dialog, first you’ll need to pick a driver that you want to use
(Step 1, ![]() ). In order to do this, you’ll need to
know which driver is used to talk to the device. If you’re unsure, you can
either try the driver which you think may fit best or you can check the
sigrok wiki. For every supported
device there’s a wiki page, showing you which driver is used.
). In order to do this, you’ll need to
know which driver is used to talk to the device. If you’re unsure, you can
either try the driver which you think may fit best or you can check the
sigrok wiki. For every supported
device there’s a wiki page, showing you which driver is used.
Once the driver has been chosen, you need to select the interface (Step 2,
![]() ). Please be aware that USB is only usable for
devices that directly communicate over USB. Devices that use USB to emulate a
serial port (like many multimeters) will have their serial port listed in the
serial port drop-down. The GPIB interface option is only available, if you have
build
). Please be aware that USB is only usable for
devices that directly communicate over USB. Devices that use USB to emulate a
serial port (like many multimeters) will have their serial port listed in the
serial port drop-down. The GPIB interface option is only available, if you have
build libsigrok with linux-gbip support under Linux.
In case your device connects via Ethernet, you must supply the IP address and port. You are also given the option to choose between raw TCP access and using the VXI protocol. VXI is an industry standard which is mainly used in professional equipment and the device will most likely let you know that it supports VXI. If your device however is more of a hobbyist grade device, it’s more likely that using raw TCP will be the correct choice.
After you selected the appropriate options, clicking the Scan button
(Step 3, ![]() ) will make SmuView try to connect to the
device with the given settings. If successful, any device(s) found will be shown
in the list box (Step 4,
) will make SmuView try to connect to the
device with the given settings. If successful, any device(s) found will be shown
in the list box (Step 4, ![]() ).
).
To avoid having to manually enter the device configuration for a serial port or
Ethernet device every time you want to use it and then having to scan for it,
you can also use the command line parameter -d or --driver to have
SmuView scan for it on startup:
smuview -d arachnid-labs-re-load-pro:conn=/dev/ttyUSB0
smuview -d korad-kaxxxxp:conn=/dev/ttyUSB1:force_detect=KORADKA3005PV2.0
| All possible connection parameters are documented in the sigrok wiki. |
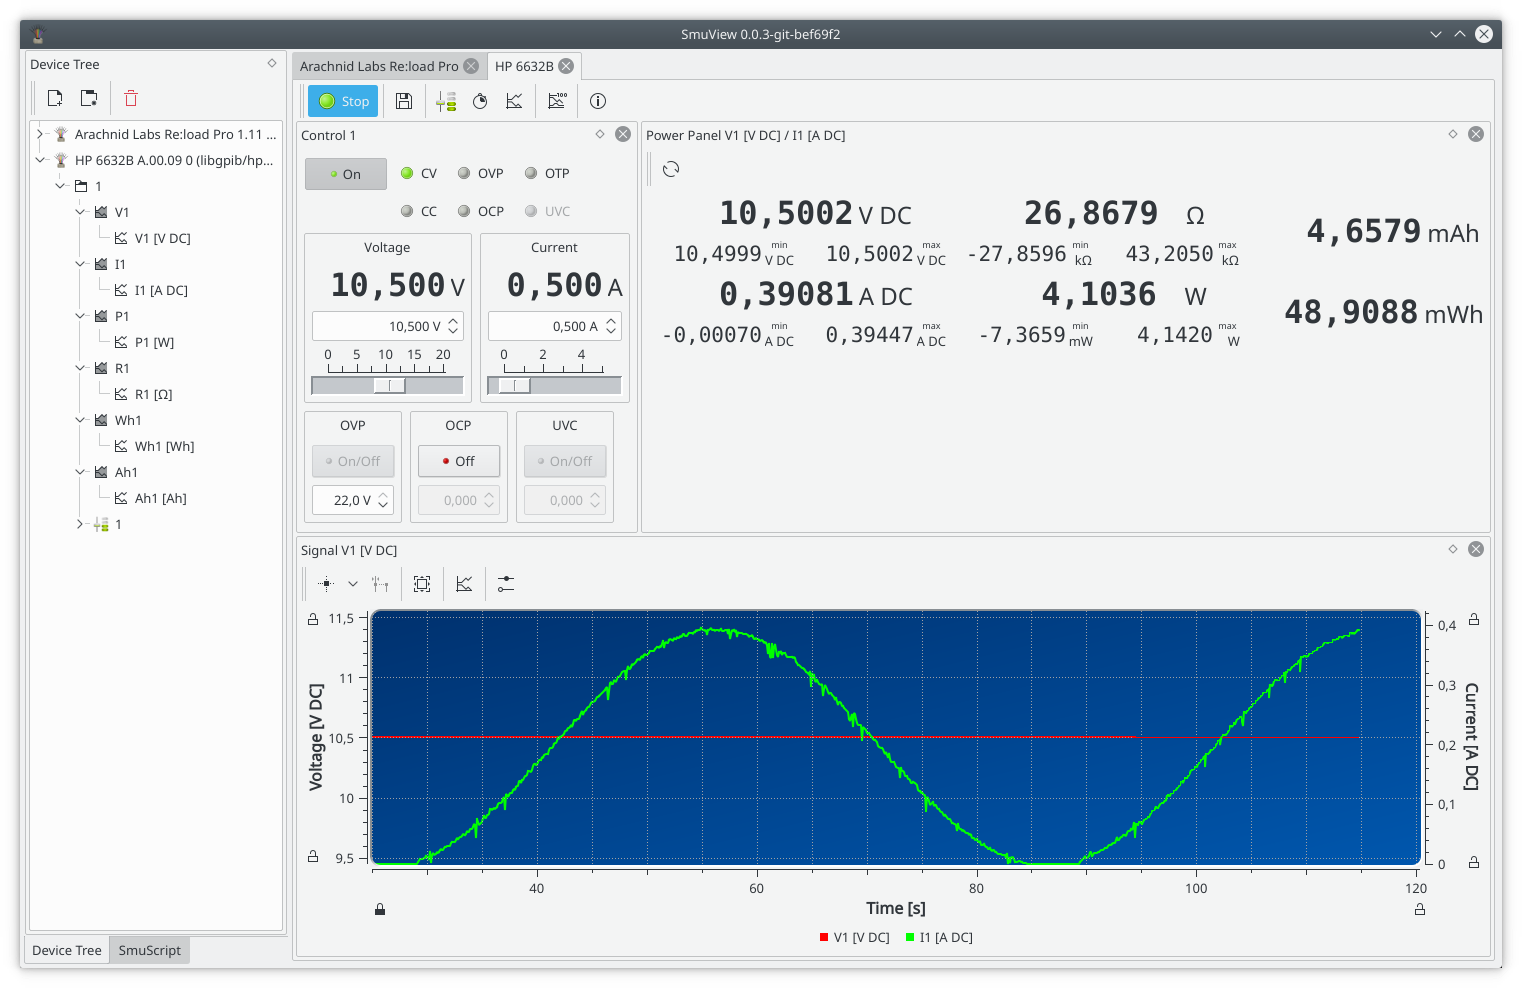
Connecting a device for the first time, some default views are shown, like control views and visualisation views, depending on the device type and the features that device supports. You are free to customize what views are displayed and the position and size of that views.
When reconnecting that device (identified by its name and serial id or
connection string) again, your previous view settings will be restored. To
connect a already known device without its stored settings but with its default
settings, you have to start SmuView with the command line parameter -c.
3.2. Default Functions
When you connect a device, you will get the following default functions:
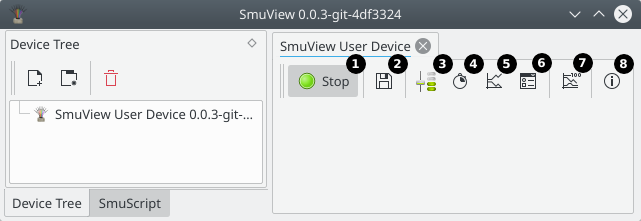
![]() Start/Stop data acquisition for this device.
Start/Stop data acquisition for this device.
![]() Save acquired data to a CSV file.
Save acquired data to a CSV file.
![]() Add a new control view.
Add a new control view.
![]() Add a new value panel view.
Add a new value panel view.
![]() Add a new time plot view.
Add a new time plot view.
![]() Add a new data table view.
Add a new data table view.
![]() Create a new math channel.
Create a new math channel.
![]() Open the about dialog.
Open the about dialog.
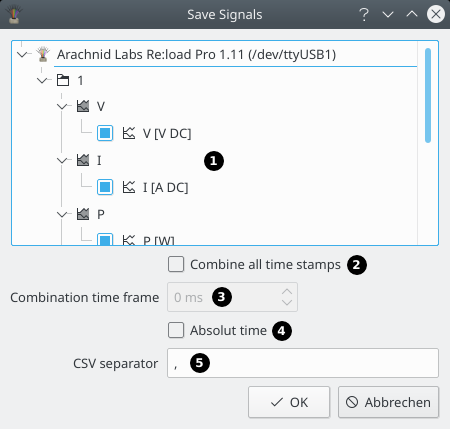
3.2.1. Export Data
All acquired data (signals) can be saved to a CSV file by clicking
the save button (![]() ) in the device tab.
) in the device tab.
There a several options to affect the resulting CSV file. Of course you are able
to choose which signals should be save. The signals from the actual device are
selected by default (![]() ).
).
Next you can determine how the data of the signals should be arranged. When the
Combine all timestamps option (![]() ) is disabled, four
header rows are generated. The first row indicates the device, the second
indicates the channel group, the third the channel and the fourth identifies the
signal itself. Each signal has two columns: One for the timestamp (in seconds)
and one for the value of the signal at that given time (see
table 1).
) is disabled, four
header rows are generated. The first row indicates the device, the second
indicates the channel group, the third the channel and the fourth identifies the
signal itself. Each signal has two columns: One for the timestamp (in seconds)
and one for the value of the signal at that given time (see
table 1).
Demo device |
Demo device |
Demo device |
Demo device |
Demo device |
Demo device |
Analog |
Analog |
Analog |
Analog |
Analog |
Analog |
A1 |
A1 |
A2 |
A2 |
A3 |
A3 |
Time A1 [V DC] |
A1 [V DC] |
Time A2 [V DC] |
A2 [V DC] |
Time A3 [V DC] |
A3 [V DC] |
0.3400 |
0 |
0.3600 |
0 |
0.3400 |
0 |
0.5400 |
3.09017 |
0.5400 |
2 |
0.5400 |
1 |
0.7400 |
5.87785 |
0.7400 |
4 |
0.7300 |
2 |
0.9410 |
8.09017 |
0.9410 |
6 |
0.9410 |
3 |
The CSV file produced with the Combine all timestamps option
(![]() ) enabled has also four header rows, similar to the
example above, except that only one timestamp column (1st column) will be
generated for all signals followed by one column for each signal (see
table 2).
) enabled has also four header rows, similar to the
example above, except that only one timestamp column (1st column) will be
generated for all signals followed by one column for each signal (see
table 2).
Time |
Demo device |
Demo device |
Demo device |
Time |
Analog |
Analog |
Analog |
Time |
A1 |
A2 |
A3 |
Time |
A1 [V DC] |
A2 [V DC] |
A3 [V DC] |
0.3400 |
0 |
0 |
|
0.3600 |
0 |
||
0.5400 |
3.09017 |
2 |
1 |
0.7300 |
2 |
||
0.7400 |
5.87785 |
4 |
|
0.9410 |
8.09017 |
6 |
3 |
When the Combine all timestamps option (![]() ) is
enabled you can also define a Combination time frame
(
) is
enabled you can also define a Combination time frame
(![]() ) which will combine values into one timestamp,
when they fall into the defined time span (see table 3).
) which will combine values into one timestamp,
when they fall into the defined time span (see table 3).
Time |
Demo device |
Demo device |
Demo device |
Time |
Analog |
Analog |
Analog |
Time |
A1 |
A2 |
A3 |
Time |
A1 [V DC] |
A2 [V DC] |
A3 [V DC] |
0.3400 |
0 |
0 |
0 |
0.5400 |
3.09017 |
2 |
1 |
0.7300 |
5.87785 |
4 |
2 |
0.9410 |
8.09017 |
6 |
3 |
By enabling the option Absolute time (![]() ), the time
column(s) will contain an absolute timestamp in the format
), the time
column(s) will contain an absolute timestamp in the format
yyyy.MM.dd hh:mm:ss.zzz, otherwise the timestamp will be relative to the start
of the SmuView application is seconds (see table 4).
Time |
Demo device |
Demo device |
Demo device |
Time |
Analog |
Analog |
Analog |
Time |
A1 |
A2 |
A3 |
Time |
A1 [V DC] |
A2 [V DC] |
A3 [V DC] |
2021.01.04 19:05:38.917 |
0 |
0 |
|
2021.01.04 19:05:38.937 |
0 |
||
2021.01.04 19:05:39.117 |
3.09017 |
2 |
1 |
2021.01.04 19:05:39.307 |
2 |
||
2021.01.04 19:05:39.317 |
5.87785 |
4 |
|
2021.01.04 19:05:39.518 |
8.09017 |
6 |
3 |
You can also define a custom CSV separator (![]() ) used
as the separation character in the CSV file.
) used
as the separation character in the CSV file.
3.3. Device types
3.3.1. Measurement Device
A measurement device can be everything from a multimeter over a thermometer to a scale.
Most of the measurement devices are not controllable and have no channel groups.
3.3.2. Power Supply
Most of the supported power supplies are controllable and have one or more channel group with a voltage channel and a current channel. Some power supplies may have additional channels like for power or frequency. The channels contain only one signal with a fixed quantity and unit.
Math channels for power, resistance, Wh and Ah are automatically generated if not provided by the device.
3.3.3. Electronic Load
All of the supported loads are controllable and have one channel group with a voltage channel and a current channel. Some loads may have additional channels like for power or Ah. The channels contain only one signal with a fixed quantity and unit.
Math channels for power, resistance, Wh and Ah are automatically generated if not provided by the device.
3.3.4. Oscilloscope
Oscilloscopes aren’t supported yet, but will be in the future!
Oscilloscopes have a channel group for each scope channel and one channel per channel group with a signal for each captured frame. The controllable for a channel group is responsible for the vertical settings of the correspondig scope channel. The controllable for the device itself controls the timebase, the trigger settings and so on.
3.3.5. User Device
A user devices has no hardware device attached to it and is basically a virtual device. It may contain math channels or visualisation and control views from other devices to build a custom GUI.
4. Data Visualisation
SmuView can visualize the captured data in various views. When a devices is connected, some common views are automatically displayed, depending on the device type and the available features of the connected device.
You can close views and create new ones via the tool bar of the device tab.
4.1. Value Panel View
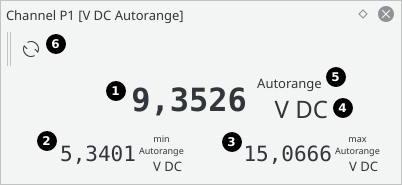
The value panel view displays the actual value (![]() )
of a signal or channel. Also the minimum (
)
of a signal or channel. Also the minimum (![]() ) and
maximum (
) and
maximum (![]() ) values since the last reset are shown.
) values since the last reset are shown.
Each value can have a unit (![]() ) and optional flags
(
) and optional flags
(![]() )
)
The minimum and maximum value can be reset with the tool bar button
![]() .
.
4.2. Power Panel View
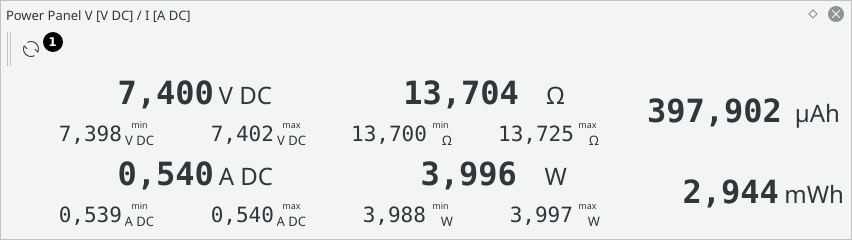
The power panel view is shown for power supplies and electronic loads. This view is using the voltage and current channel for calculating resistance, power, Wh and Ah. Also the minimum and maximum values since the last reset are shown.
The minimum, maximum, Wh and Ah values can be reset with the tool bar buttion
![]() .
.
There is no tool bar button in the device tab to show a power panel view, but it is accesible over the Add View dialog in the device tab.
4.3. Data Table View
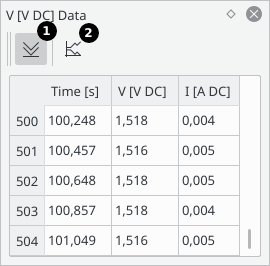
The data table view shows all available sample points for one or more signals.
You can control if the table scrolls to the bottom or stays at a given position
with the tool bar button ![]() and you can add new
signals to the table via the tool bar button
and you can add new
signals to the table via the tool bar button ![]() .
.
4.4. Time Plot View
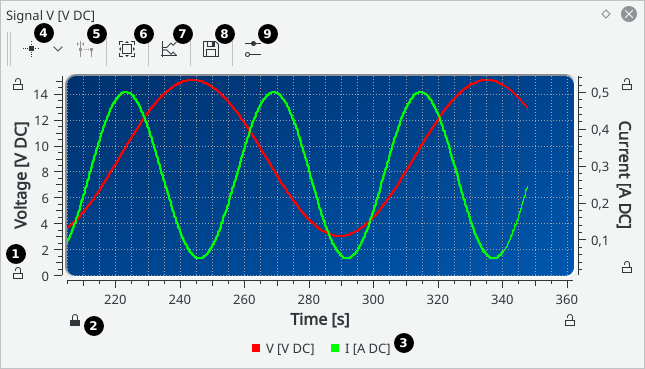
The time plot view shows one or more channels or signals in a plot over time.
You can move the plot by dragging the plot canvas or by dragging the axis and you can zoom the whole plot by scrolling inside the plot canvas or zooming a specific axis by using the mouse wheel over the axis.
When double clicking an axis, you can manually set the axis boundaries, lock the
boundaries and set an axis scale (linear or logarithmic). With the lock symbols
(![]() and
and ![]() ) at the axis, you
can also lock a axis boundary. When clicking on a signal label
(
) at the axis, you
can also lock a axis boundary. When clicking on a signal label
(![]() ), you can change the curve name, the visibility,
color, line type and symbol type of the corresponding signal.
), you can change the curve name, the visibility,
color, line type and symbol type of the corresponding signal.
You can add plot markers (![]() ), differential markers
(
), differential markers
(![]() ), resize to best fit (
), resize to best fit (![]() ),
and add new signals (
),
and add new signals (![]() ) to the plot via the tool bar.
) to the plot via the tool bar.
The plot can be saved (tool bar button ![]() ) to various image formats like SVG, PDF, PNG, etc. At the moment, the image size is fixed.
) to various image formats like SVG, PDF, PNG, etc. At the moment, the image size is fixed.
You can also configure the plot with the tool bar button
![]() : Change the plot mode (additive, rolling,
oscilloscope) and change the display position of the markers info box.
: Change the plot mode (additive, rolling,
oscilloscope) and change the display position of the markers info box.
4.5. X/Y-Plot View
The X/Y-plot view shows two signals in X/Y-mode. It has the same functionality as the time plot view.
5. Data Processing
SmuView can process and combine channels via math channels.
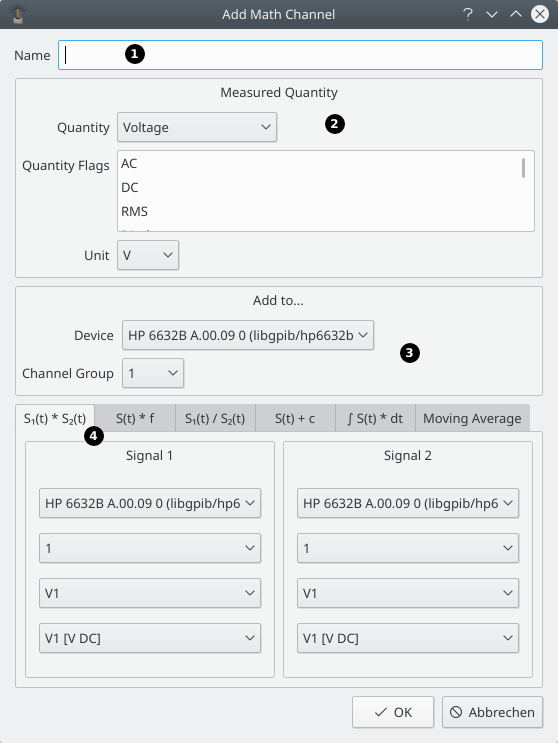
![]() Name of the new math channel.
Name of the new math channel.
![]() Selection for the quantity, the quantity flags and
the unit of the new math channel.
Selection for the quantity, the quantity flags and
the unit of the new math channel.
![]() Selection to which device and channel group the new
math channel should be added to.
Selection to which device and channel group the new
math channel should be added to.
![]() Various types of math channels.
Various types of math channels.
One example this could be used is, when you measure a current via the voltage drop over a shunt resistor with a DMM. With the multiplication of a constant factor and the voltage signal of the DMM you can generate a current channel with the correct values in the correct unit (Ampere).
This types of math channels are currently implemented:
-
Multiplication of two signals.
-
Multiplication of a signal and a constant factor.
-
Division of two signals.
-
Addition of a signal and a constant value.
-
Integration of a signal over time.
-
Moving average of a signal.
As an alternative to math channels, you can use SmuScript to do far more complex signal processing.
6. Device Control
SmuView can control devices, depending on the device type and the available features of the connected device. When a device is connected and it is controllable, control views are automatically displayed.
You can close control views and create new ones via the tool bar of the device tab.
6.1. Control View
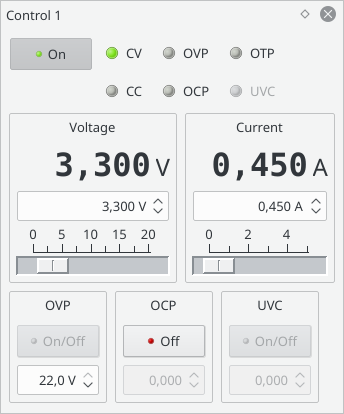
Depending on the device type the control view looks different and functions may be disabled.
Power supplies and electronic loads have a very similar control view, which gives access to all possible functions supported by the sigrok library.
Other controllable devices like sound level meters will have a generic control view.
6.2. Sequence Output View
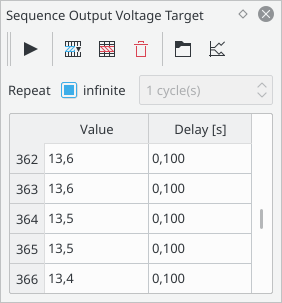
Some config keys of a device (for example the output voltage of a power supply) can be set to a sequence of values. The sequence can be played one or more times. You can generate sine, triangle, sawtooth and square wave sequences, load a sequence from a CSV file or enter the sequence manually.
There is no tool bar button in the device tab to show a sequence output view yet, but it is accesible over the Add View dialog in the device tab.
7. SmuScript
SmuView has a python scripting extension to automate, setup and control complex or repetitive measurements, to process the incoming data and to create a standardized user interface for those measurements.
The smuview python module offers two default object instances: Session and
UiProxy.
The Session object gives access to already connected devices or connects new
devices. The returned device object can then be used to read data from the
device or control the device.
The UiProxy object instance is used to modify the user interface, for example
adding tabs or views.
| Only one script can be executed at a time! |
You can find an API documentation here
and example scripts in the smuscript folder.
SmuView provides a basic editor to edit and run scripts. Here you can use the keyboard shortcuts Ctrl+S to save the actual file and Ctrl+F to open the search and replace dialog.
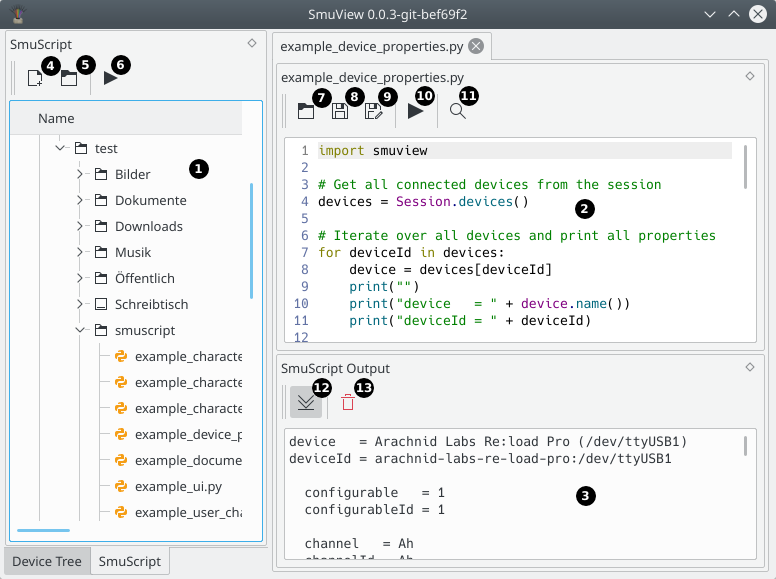
![]() Directory tree.
Directory tree.
![]() Script editor.
Script editor.
![]() Script output.
Script output.
![]() Create a new script.
Create a new script.
![]() Open the selected script file.
Open the selected script file.
![]() Execute the selected script file.
Execute the selected script file.
![]() Open new script file.
Open new script file.
![]() Save script file.
Save script file.
![]() Save script file with a new name.
Save script file with a new name.
![]() Execute script file.
Execute script file.
![]() Open Search & Replace dialog.
Open Search & Replace dialog.
![]() Scroll to bottom.
Scroll to bottom.
![]() Clear output window.
Clear output window.
SmuScripts can also be started on startup, using the command line parameter
-s:
smuview -s /path/to/script.py
7.1. Examples
The following short example connects the HP 3378A DMM via GPIB, reads a sample and creates the default tab for the device:
import smuview
import time

# Connect device.
dmm_dev = Session.connect_device("hp-3478a:conn=libgpib/hp3478a")[0]
# Sleep 1s to give the devices the chance to create signals
time.sleep(1)
# Get last sample from channel P1
sample = dmm_dev.channels()["P1"].actual_signal().get_last_sample(True)
print(sample)

# Add default tab for the DMM device.
UiProxy.add_device_tab(dmm_dev)
The following more complex example script from the smuscript folder
characterizes a battery and plots the resulting graph:
import smuview
import time

# Connect devices
load_device = Session.connect_device("arachnid-labs-re-load-pro:conn=/dev/ttyUSB1")[0]
load_conf = load_device.configurables()["1"]
dmm_device = Session.connect_device("hp-3478a:conn=libgpib/hp3478a")[0]
dmm_conf = dmm_device.configurables()[""]

# Init device settings
load_conf.set_config(smuview.ConfigKey.CurrentLimit, .0)
dmm_conf.set_config(smuview.ConfigKey.MeasuredQuantity, smuview.Quantity.Voltage)

# Give the devices the chance to create signals
time.sleep(1)

# Add user device
user_device = Session.add_user_device()
# Add channel for measurement values
user_device.add_user_channel("Results", "User")
result_ch = user_device.channels()["Results"]

# Show device tabs and add plot to user device
UiProxy.add_device_tab(load_device)
UiProxy.add_device_tab(dmm_device)
UiProxy.add_device_tab(user_device)
UiProxy.add_plot_view(user_device.id(), smuview.DockArea.BottomDockArea, result_ch)

# Start test
load_conf.set_config(smuview.ConfigKey.CurrentLimit, .150)

# Drain the battery until it is below 0.5 Volt
value = 100
while value > 0.5:
    # Take a reading every 2s and write it to the user channel
    time_stamp = time.time()
    value = dmm_device.channels()["P1"].actual_signal().get_last_sample(True)[1]
    result_ch.push_sample(value, time_stamp, smuview.Quantity.Voltage, set(), smuview.Unit.Volt, 6, 5)
    time.sleep(2)

# Set device settings to a save state
load_conf.set_config(smuview.ConfigKey.CurrentLimit, .0)
8. Command Line Interface
Even though SmuView has a graphical user interface, there is also a command line interface that you can make use of. It is meant to provide functions for convenience and debug purposes, not to replace the user interface itself.
Windows only shows output on the command line when the debug build is used.
Running
smuview -h
gives you a list of all available options.
Since SmuView can’t automatically scan for devices connected to a COM port
(ttySx on Linux) or Ethernet, you can tell it to look for a specific device
using the -d or --driver parameter. Its usage is the same as for
sigrok-cli. All possible connection parameters are documented in the
sigrok wiki. For example:
smuview -d arachnid-labs-re-load-pro:conn=/dev/ttyUSB0
You also can start smuscripts from the command line with the -s or --script
parameter:
smuview -s /path/to/example_script.py
The remaining parameters are mostly for debug purposes:
-V / --version		Shows the release version
-l / --loglevel		Sets the libsigrok/libsigrokdecode log level (max is 5)
-D / --dont-scan	Do not auto-scan for devices and use -d spec only
-c / --clean		Do not restore previous settings on startup
Of these, -D / --dont-scan can be useful when SmuView gets stuck during
the startup device scan. No such scan will be performed then, allowing the
program to start up but you’ll have to scan for your acquisition device(s)
manually before you can use them.
Another potentially useful option is -c / --clean, which can be used when
SmuView doesn’t start up and you don’t know what could cause this.
Thus, the combination of both parameters can be seen as some kind of "safe mode" for SmuView:
smuview -c -D
9. License
SmuView is licensed under the terms of the GNU General Public License (GPL), version 3 or later. To view a copy of this license, visit https://www.gnu.org/licenses/gpl-3.0.html.
This manual is licensed under the Creative Commons Attribution-ShareAlike 4.0 International License. To view a copy of this license, visit https://creativecommons.org/licenses/by-sa/4.0/ or send a letter to Creative Commons, PO Box 1866, Mountain View, CA 94042, USA.